PCMH Plus Year 1 Performance and Savings Results: Increased state costs but little evidence of impact on quality
This month, Connecticut Medicaid announced the first year performance of PCMH Plus[1], their controversial new shared savings program[2] compared to the prior year. Under shared savings, if health systems (ACOs) are able to lower the cost of their members’ care, they receive a bonus equal to half those savings. PCMH Plus was also designed to reward quality improvement, even if it’s not accompanied by savings. From its inception in January 2017, independent advocates have been concerned that the shared savings payment model creates incentives to deny appropriate care (underservice) and to shift less lucrative, difficult members out of the program (cherry picking), as has happened in other states and with managed care organizations in Connecticut’s past with similar incentives.
PCMH Plus’s first year report provides little evidence that the program had any impact on quality improvement or savings despite at least $1.3 million in net costs to the state. Every ACO, regardless of savings or quality performance, was rewarded with a payment. There does not appear to be a link between payments to ACOs and quality; the highest and lowest quality performing ACOs received the same size payment per member-months (pmpm).
The report included the total cost of healthcare for members, utilization of services, and the quality of care in the nine PCMH Plus ACOs, compared to a matched comparison group of Medicaid members who get care from patient-centered medical homes not participating in PCMH Plus. The groups were compared on savings, quality and utilization of services for both the first year of PCMH Plus (2017) and the year before the program began (2016).
Little evidence of PCMH Plus savings, payments not linked to quality
Savings attributed to PCMH Plus totaled $433,000 but savings payments to the ACOs totaled $1,735,498 resulting in a net loss to the state of over $1.3 million[3]. Four of the nine ACOs saved money but all received savings payments. The program was designed to reward quality improvement, even without savings. Consequently, the five ACOs that did not save on the care of their members also received payments. In addition to these payments, the ACOs received $4.7 million through Medicaid and more from the State Innovation Model (SIM) grant in additional payments to participate in the program.
| Annual trend | Savings/losses performance | PCMH Plus payments | Payments per member months rank | Quality score rank | |
| Comparison group | -1.03% | ||||
| All ACOs | -1.12% | -$433,000 | $1,735,498 | ||
| NEMG | -0.70% | $84,000 | $61,597 | 4 | 3 |
| St. Vincent’s | -1.51% | -$304,000 | $199,044 | 3 | 4 |
| Charter Oak | -6.92% | -$1,520,000 | $496,657 | 1 | 5 |
| CHC Inc | 0.00% | $1,754,000 | $248,358 | 5 (tie) | 6 (tie) |
| C Scott Hill | -0.25% | $433,000 | $80,016 | 5 (tie) | 9 |
| Fairhaven | 0.34% | $373,000 | $44,249 | 5 (tie) | 2 |
| Generations | 3.19% | $1,096,000 | $21,748 | 9 | 8 |
| Optimus | -3.43% | -$1,951,000 | $537,164 | 2 | 6 (tie) |
| Southwest | -2.15% | -$408,000 | $46,665 | 5 (tie) | 1 |
Since January 2012, when Connecticut Medicaid shifted from a capitated, insurer-based payment model to one focused on care coordination and quality, per person costs in the program have fallen. Connecticut is now a national leader in Medicaid cost control. That trend continued through 2016 and 2017. Total costs of care of both the comparison group and ACO members, in aggregate, were lower in 2017 than 2016.
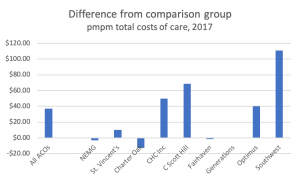
Beyond that background of underlying Medicaid cost reductions, the impact of PCMH Plus on total cost of care is mixed and varies substantially between ACOs. The cost of care for ACO members was higher before the program and remained higher in the first year. The pmpm costs of care for ACO members were $37.66 higher in 2016, before PCMH Plus implementation, than for the comparison group. In 2017, during PCMH Plus’s first year, the ACOs narrowed that gap only slightly, still costing $36.85 pmpm more than the comparison group. Individual ACOs’ performance compared to the comparison group varied substantially. In 2017, five ACOs’ pmpm costs were similar to the comparison group, but four ACOs’ were substantially higher.
Little evidence of quality improvement
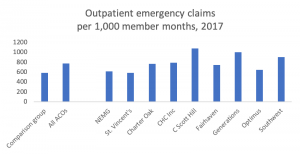
The report offers little evidence that PCMH Plus improved quality. Emergency outpatient visits are an important and closely watched measure, as members having difficulty accessing primary care are often forced to an ER for services. Emergency visits for ACO members were much higher than for the comparison group in both years. All but one of the ACOs’ members were more likely to seek care for an emergency than the comparison group. While emergency visits fell across all of Medicaid, the gap between ACO members’ risk of an emergency visit and the comparison group did not change substantially.
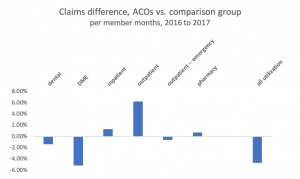
There are signals of underservice in the report that warrant investigation. Underservice, the denial of necessary care, is a serious but anticipated risk in shared savings programs. Both dental and durable medical equipment utilization fell for ACO members far more than for the comparison group in the report. Neither category should be falling. Inpatient care, already higher for ACO members before the program, dropped less than for the comparison group. Also troubling, outpatient care dropped for both ACO and comparison group members.
Outstanding questions
- What is the explanation for reductions in utilization between ACOs and comparison group practices? Is there evidence of underservice?
- How did behavioral health spending change in PCMH Plus? Expansion of behavioral health capacity and integration with medical care was an important part of the program’s design and hopes for improved quality.
- How did the ratio of spending on primary and specialty care change with PCMH Plus? The program was designed to empower and expand access to primary care.
- How did the utilization of high- and low- value services change with implementation? Are some ACOs doing a better job of providing high value care? If so, what are the best practices and how do we share them with others?
- What were the rates of preventable ED and hospital admissions by ACO before and after PCMH Plus implementation? These measures have been reported by Medicare ACOs for many years and are a critical indicator of underservice.
- What did the ACOs do with their grants and Medicaid payments? It was expected that ACOs would reinvest those funds in improving the quality of care.
- Were higher community health center payment rates incorporated into the analysis? Community health centers, the majority of participants in PCMH Plus, are paid far higher Medicaid rates than community providers.
- What happened to high-cost, high need members? How many hit the $100,000 truncation limit (by ACO), what caused their high bills, and was the problem acute or ongoing? How many members of the comparison group had costs of care over $100,000? Monitor and report on the impact of transferring out some, but not all, ACO members with complex medical needs from the existing, successful Intensive Care Management (ICM) program to ACO care management. Ensure no ICM savings being attributed to the ACOs. Monitor the health status and utilization patterns of high-need members who’ve left the ICM program to be managed by the ACOs.
- How did including risk scores in shared savings calculations impact the final payments? Questions were raised about the use of risk scores to adjust the per member per month costs in savings calculations. Members attributed to the comparison group dropped from 2016 to 2017, but risk scores rose for the overall PCMH Plus population adding to concerns about the program’s impact on quality. Both populations were longitudinal, meaning the same members were measured and compared in each of the two years. Risk score adjustments are meant to reduce incentives for ACOs to avoid high need members, however risk scores can potentially be affected by the level of care provided to members. Concerns were raised in the PCMH Plus analysis because the ACO that garnered the largest savings payment by far, also had by far the largest jump in risk scores for their members between 2016 and 2017.
[1] Person-Centered Medical Home Plus (PCMH+) Year 1 Results: Shared Savings Calculations, Mercer, December 14, 2018
[2] PCMH Plus Update, Medicaid Study Group, June 2017
[3] SIM upfront payments to the ACOs were not reflected in the report but DSS has committed to reporting those costs. Consulting costs are also not reflected in the report.


