
Has MA’s cost cap worked? Should CT copy it?

The latest reports (here and here) on Massachusetts’s first-in-the-nation cost cap project raise questions about whether it has worked. Since the cap was implemented in 2013, consumer costs are growing faster than overall healthcare, inflation, or incomes. Despite almost eight years under their cost cap, Massachusetts’s out-of-pocket costs and premiums have grown almost twice as fast as overall healthcare costs. Administrative costs are consuming a growing share of premiums in Massachusetts, rising 16.9% in 2018, and a growing share of those costs are devoted to profit. Trends for Connecticut and Massachusetts’s commercial total healthcare costs, premiums, and deductibles have been similar since 2009. These results raise serious questions about the Office of Health Strategy’s controversial plan to copy Massachusetts’s expensive cost cap here.
Since the cap was implemented, there is little difference between Connecticut and Massachusetts’s growth in total premiums, employee share of premiums, or deductibles.
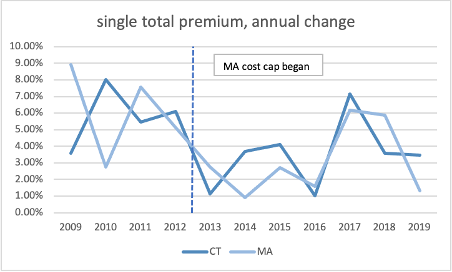
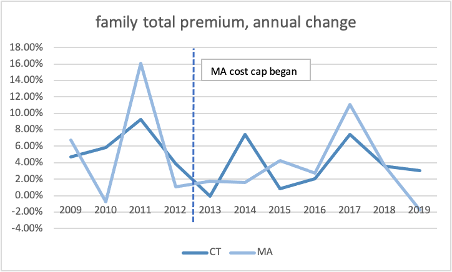
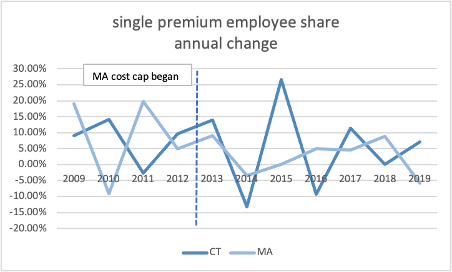
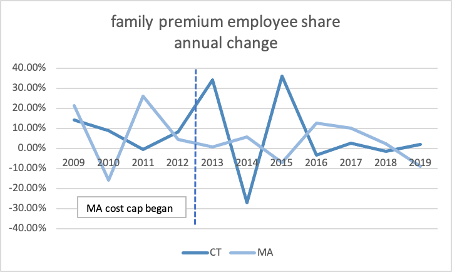
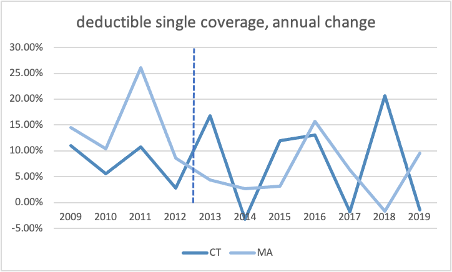
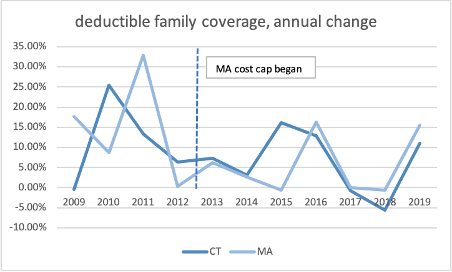
Source: Medical Expenditure Panel Survey, AHRQ, US HHS
As in Connecticut, affordability of healthcare is a serious and growing concern in Massachusetts, despite almost eight years under their Cost Cap. Cost-sharing for people with commercial coverage grew 5.6% in 2018, on top of a 6.7% increase the year before, driven largely by high-deductible health plans. This rate of growth is well above overall healthcare costs which grew 3.1% in 2018, and far exceeds inflation or income growth. Unsubsidized customers and small businesses were hit the hardest with out-of-pocket costs growing 7.3% and 10.2% respectively.
According to the Massachusetts Health Policy Commission report, one in four (23%) middle class families in Massachusetts spend over a quarter of their incomes on healthcare. These growing costs squeezed out wage increases. Massachusetts’s cost cap agency estimates that 40% of additional income earned by state workers between 2016 and 2018 was consumed by medical costs. These burdens fell hardest on underserved communities. Those rates are higher for people of color (29.4%), people with a disability or activity limitation (14.7%), and people in poorer health (31.8%).
A 2018 survey of Massachusetts residents found that almost half (49.1%) of adults in the state had difficulty accessing needed medical care; 18.6% went without care due to cost. One in five Massachusetts adults (19%) had medical debt. One in four (24.7%) used credit cards or personal loans to cover family medical debt. Again, these burdens fell hardest on modest income households, people with disabilities, and communities of color.
Between 2014 and 2018, since the implementation of the cost cap, commercial plan spending per person has grown 23.5% in Massachusetts, while Connecticut’s costs grew by 17.5%. Healthcare cost growth in both Massachusetts and Connecticut are driven by prices more than utilization of care, especially pharmaceutical costs.
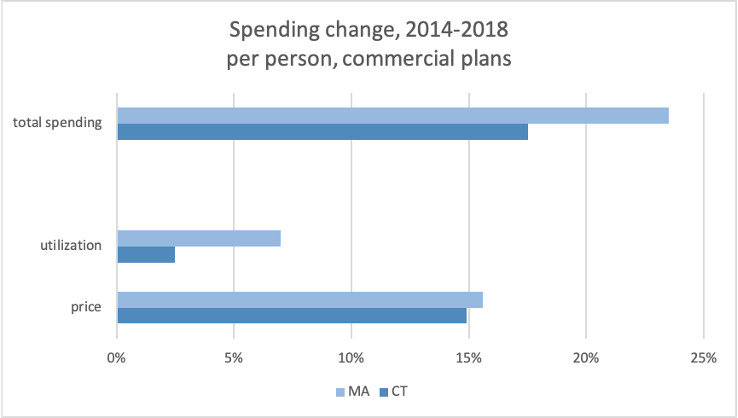
Source: 2018 Healthcare Cost and Utlization Report, Health Care Cost Insitute, does not include pharmacy rebates
The Massachusetts reports also found, as for Connecticut, per person Medicaid cost growth was far lower (0.4%) than the overall population (3.1%). Without Medicaid, Massachusetts would not have kept spending under the cap.