
Cost Cap finds hospital system costs driving healthcare spending, but we knew that


In a surprise to no one, the first analysis by the Cost Cap project finds that inpatient and outpatient hospital services are a main driver of rising healthcare spending in Connecticut. Hospital and drug costs have been identified in multiple studies as the main drivers of rising health costs in our state. Unfortunately, little has been done to address either of these drivers allowing large health systems and drug companies to continue profit-taking while consumers struggle to afford coverage and care.
The Cost Cap project, run by the Office of Health Strategy, has spent a year and $857,481 in consulting costs so far in addition to hiring state employee staff for the project.
The analysis by Mathematica includes medical spending from commercial coverage, including state employees, for state residents under age 65, from 2015 through 2018, but does not include spending on drugs. The anomalies created by the pandemic and the recession are not included in the analysis. No reason was given for excluding drug spending. Connecticut’s APCD, the source of the data, collects healthcare claims data from insurers and government payers including drug costs. The data includes patient cost share spending.
According to the analysis, per member per month costs for commercially insured CT residents under age 65 grew from 15.3% from 2015 to 2018 ($377.66 to $435.55). Most of the growth occurred from 2015 to 2016. In contrast, inflation in prices in the Northeast for all services grew 5.1% for all services and 8.0% for medical services. While costs for women are higher than for men, costs grew fastest for children and older men.

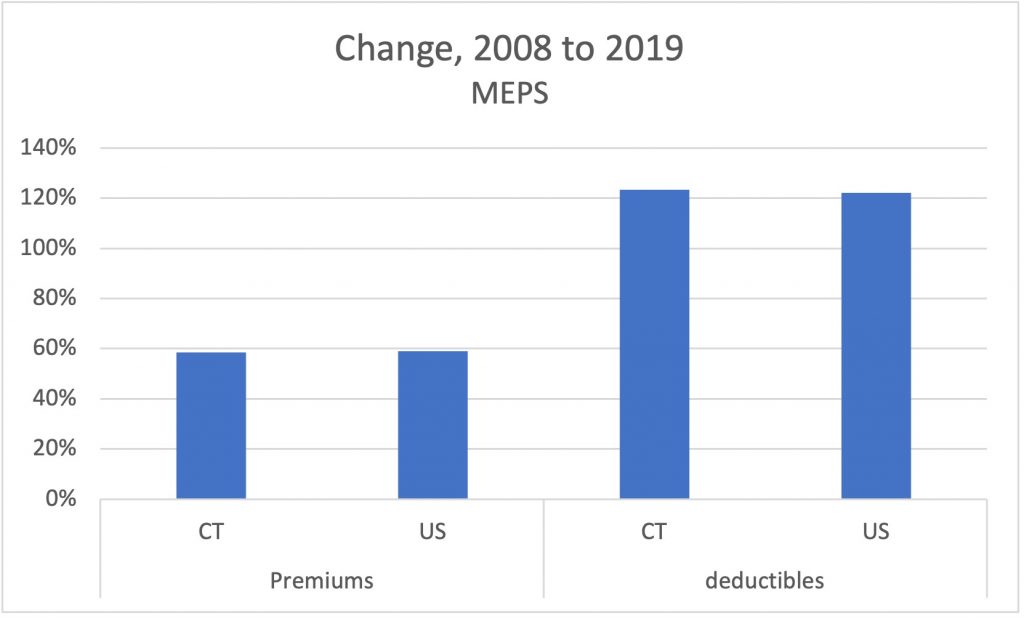
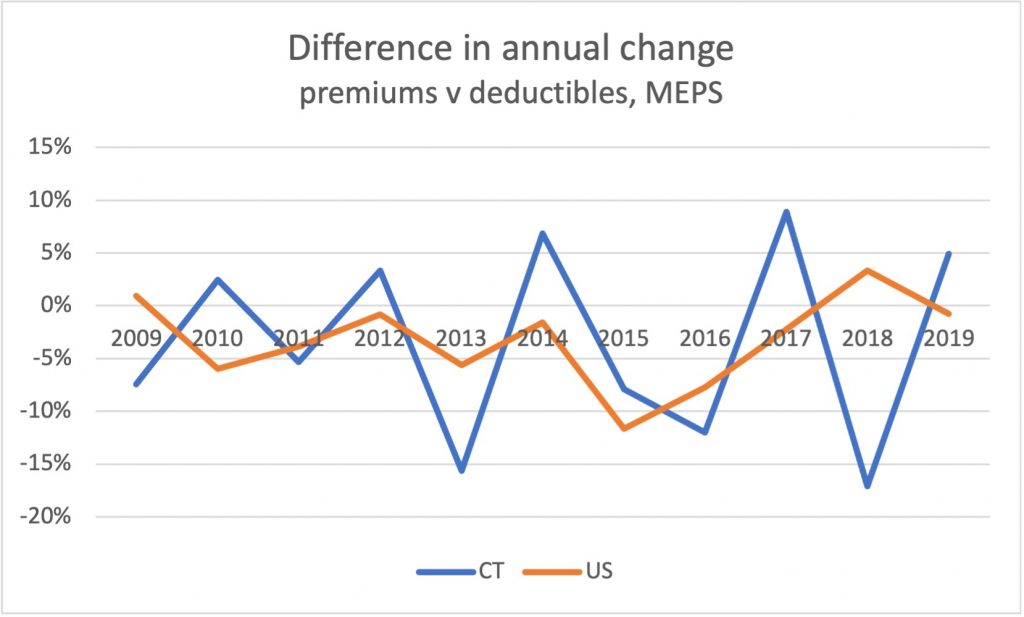
Also well-documented previously, the report finds that consumer cost sharing has grown faster than overall health spending (26.0% vs. 15.5% from 2015 to 2018). According to AHRQ’s Medical Expenditure Panel Survey, over 12 years that trend holds for both for Connecticut and the nation but is very volatile.
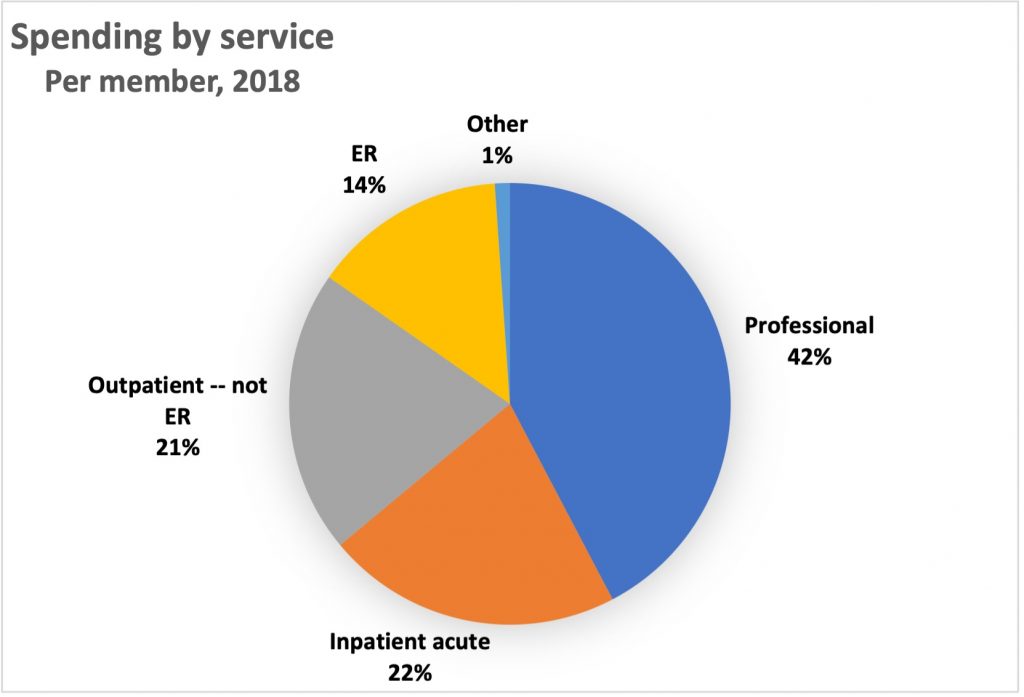
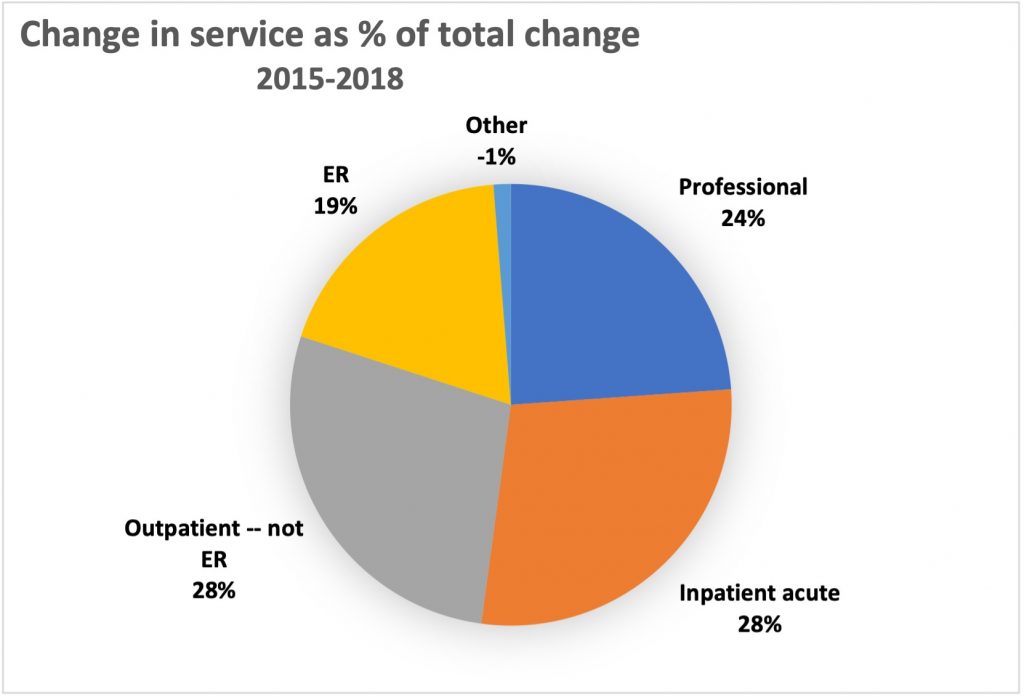
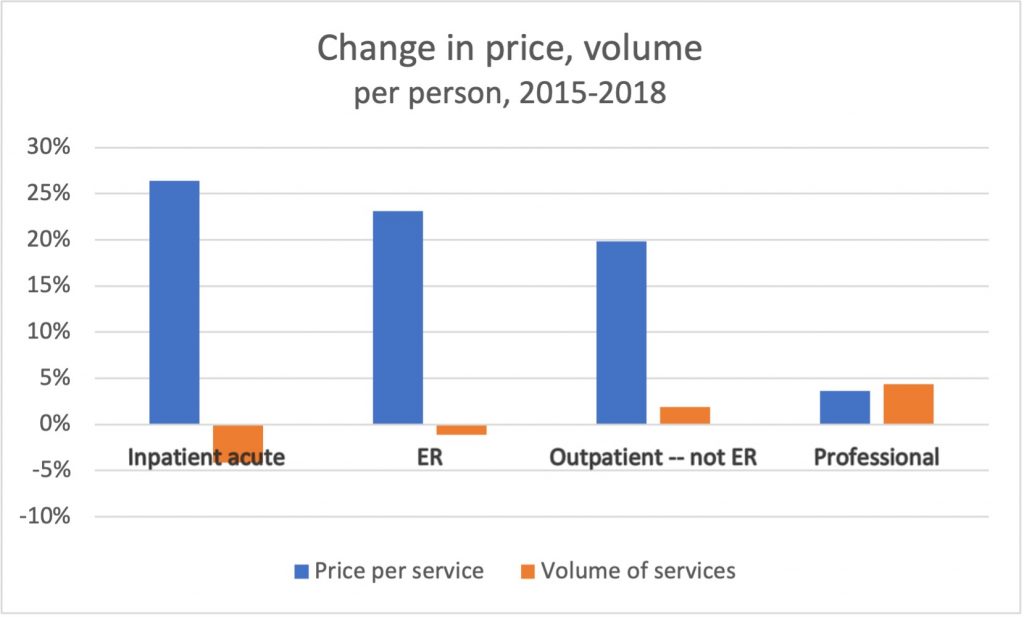
Also well-documented previously, hospital-based services accounted for most of the increase in spending, especially inpatient acute care costs. While in 2018 professional services still consumed more spending than other sectors (42%), they contributed only a quarter of the increase in spending (24%).
Also well-documented previously, prices for services, particularly hospital services, rather than volume, drove most of the increase in spending.
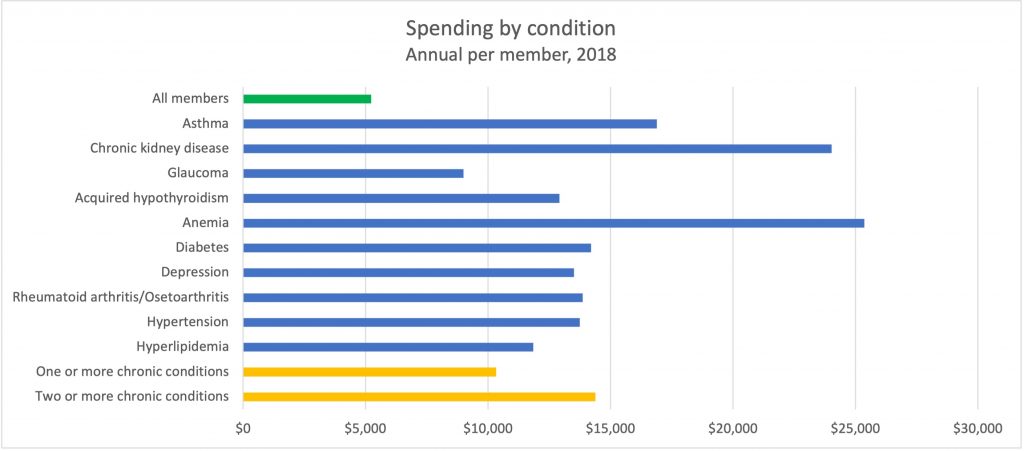
Also not surprising, spending for members with chronic conditions was higher than for most members in 2018. Members with multiple chronic conditions had higher spending. Highest cost conditions included anemia and kidney disease; however high cholesterol, high blood pressure, and arthritis were the most common chronic conditions.
The first Cost Cap analysis provides some new details a main price driver, hospitals, in Connecticut’s healthcare system. We’re looking forward to seeing their report on drug costs, the other main driver. But the hard part, is what to do about them. Policymakers are already beginning to address them.