Seven years later, Connecticut Medicaid still saving taxpayers money


As with most health care in Connecticut, Medicaid spending was rising quickly before 2012 growing by almost half over the prior four years. But in 2012, Connecticut made a remarkable and unique move — Medicaid switched from a capitated payment model using private insurers to a care coordination-focused, self-insured payment model. Since then, state spending on Medicaid has decreased, saving hundreds of millions of tax dollars annually and leading the nation in cost control. The shift also resulted in significant improvements in quality, access to care, provider participation and consumer satisfaction. At the same time enrollment in the program has grown by 550,000 members. Connecticut Medicaid accomplished this without an increase in administrative funding. Unfortunately, that progress remains politically fragile, requiring continued commitment by state policymakers to our successful model and resisting a return to private insurers.
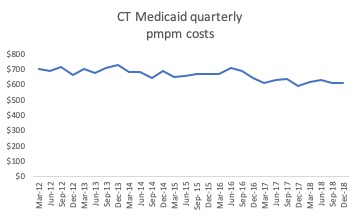
Connecticut Medicaid per member per month costs (pmpm) are down 14%, from $706 in the first quarter of 2012 to $610 in the last quarter of 2018. Connecticut Medicaid’s per enrollee costs were ninth highest among states in 2011 but down to 22nd by 2017. If Medicaid per member per month costs had held steady at 2012 levels, the state would have spent $968 million more last year.
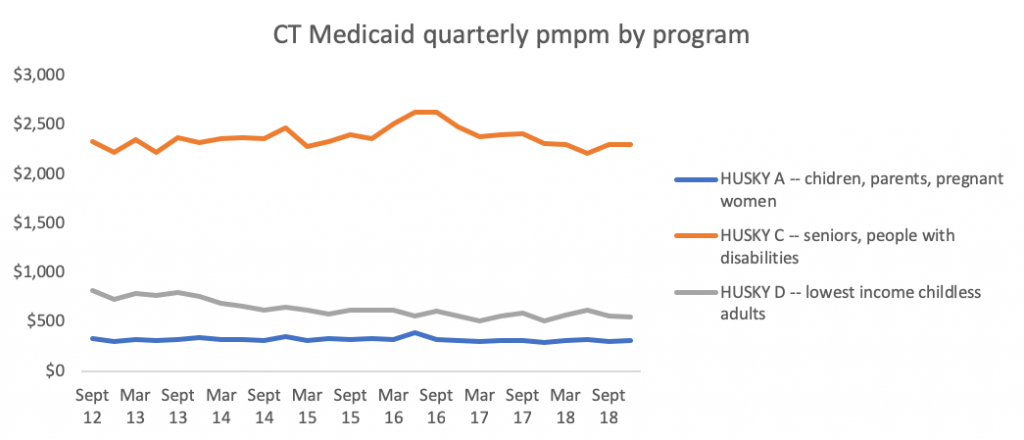
Connecticut Medicaid per member costs have been stable or declining across eligibility categories, including newly eligible childless adults, children/families, and seniors/people with high medical bills. Lower total per member costs are not the result of an influx of healthier new members.
Medicaid is not the driver of Connecticut’s growing state budget. Connecticut’s total state share of Medicaid costs has risen less quickly than the total General fund or health care costs for state employees and retirees.

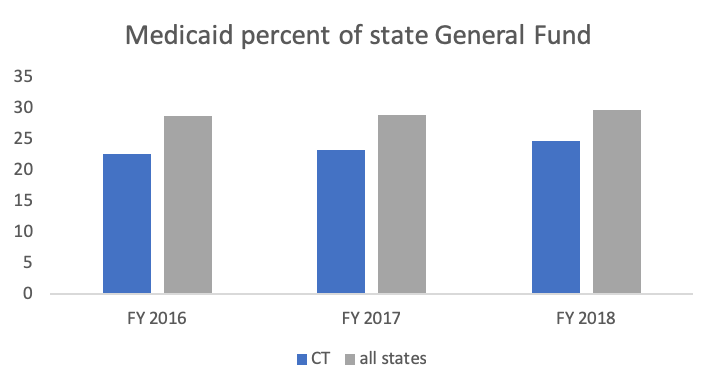
Connecticut spends less of our state budget on Medicaid than other states, spending 24.7% on Medicaid in 2017, well below other states averaging 29.7%.
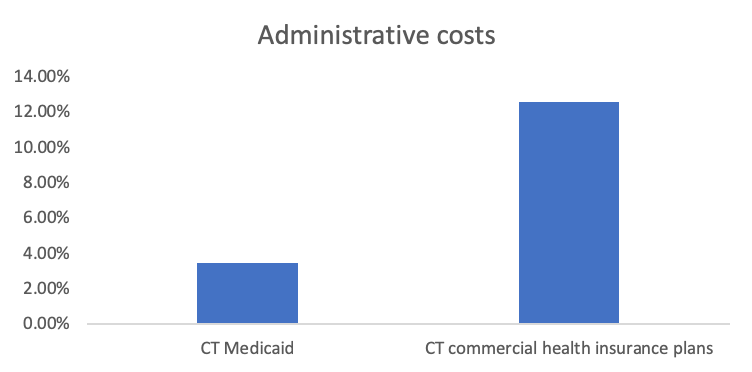
Connecticut Medicaid spends only 3.5% of total costs on administrative expenses. In contrast, commercial health insurance plans in Connecticut average 12.6% spending on administration/profit, varying between 6% and 25%.
CT Medicaid has achieved success in cost control by monitoring data on quality, utilization and spending, and adjusting the program accordingly. CT Medicaid has adopted dozens of population health and delivery system innovations, leading the state’s marketplace. A few of those innovations include:
• High-cost, high-need member interventions
• Intensive Care Management – physical and behavioral health programs
• Person-Centered Medical Homes (PCMH)
• Behavioral Health Homes to integrate physical and behavioral health care
• PCMH + shared savings
• Long Term Services and Supports rebalancing
o Home and Community-based waivers
o Nursing home right-sizing
o Workforce initiatives
o My Place consumer portal
o Community First Choice state plan option for self-directed personal care support
• CMCS Innovation Accelerator Program on Medicaid-Housing Partnerships
• Electronic health record payments
• Primary care rate increases to equal Medicare
• Hospital rate increases, payment modernization and updates
• Money Follows the Person housing and supports
• Provider payments for quality improvement, based on consumer satisfaction among other metrics
• Fully integrated claims data, moving to data match across state programs including social services and corrections
• Streamlined, consistent, reliable administration, enrollment, provider and consumer information
Bottom Line: Medicaid is not driving either rising health costs in Connecticut or the state’s budget deficit. In fact, Medicaid has provided significant relief to both state and federal budgets as well as leading innovative reform of our state’s health system.
Sources:
DSS financial presentations to MAPOC — February 2019, February 2018, January 2016, October 2015, October 2014, https://www.cga.ct.gov/med/
MACPAC 2018 Data Book, December 2018, MACStats: Medicaid and CHIP Data Book
National Health Accounts, CMS, https://www.cms.gov/Research-Statistics-Data-and-Systems/Statistics-Trends-and-Reports/NationalHealthExpendData/NationalHealthAccountsStateHealthAccountsResidence.html
NASBO State Expenditure Report FY 2016 to 2018, https://higherlogicdownload.s3.amazonaws.com/NASBO/9d2d2db1-c943-4f1b-b750-0fca152d64c2/UploadedImages/SER%20Archive/2018_State_Expenditure_Report_S.pdf
2018 CID Consumer Report Card on Health Insurance Carriers in Connecticut, Note: Administrative costs calculated from plans with over 50,000 members, average weighted by enrollment, ://portal.ct.gov/-/media/CID/2018ConsumerReportCardpdf.pdf?la=en